

TERRA EARTH vs HUMANITY EXPLOSION
World Populations are becoming unsustainable in growth rates compared to WEF (water, energy, food) resources.
The global shift has started. America Must Survive and Win.
Macro-Economic Baseline: GDP Core Architecture [$27.0T Nominal Baseline]
- The Policy Focus: Modern administrative structures frequently leverage macro-economic metrics strictly to balance sovereign liabilities, creating severe domestic regulatory strain.
- The Paradigm Shift: The Foundation analyzes the Gross Domestic Product formula—$C+I+G+(X-M)$—not as a mechanism for bureaucratic expansion, but as the primary catalyst fueling independent industrial capability.
- THE GDP CAPABILITY MATRIX: From a strategic stance, critical milestones are achieved when domestic frameworks maximize Gross Private Investment (I) to solidify the core infrastructure sectors. We are not managing a resource decline; we are architecting the permanent blueprint for an American Industrial Win.
STRATEGIC WARNING: DOMESTIC RESOURCE DEMAND LINES MUST PACESET GLOBAL GROWTH VARIOMETERS TO PRESERVE MACROECONOMIC STABILITY AND PREVENT REGIONAL SUPPLY MATRIX OVERTAKES.
| ISO | Country | C (Private) | I (Investment) | G (Govt) | X (Exports) | M (Imports) | GDP (Nominal) |
| USA | United States | $18.6T | $4.8T | $4.5T | $3.0T | $3.9T | $27.0T |
| CHN | China | $6.7T | $7.6T | $2.6T | $3.5T | $2.7T | $17.7T |
| DEU | Germany | $2.3T | $1.1T | $0.9T | $2.0T | $1.8T | $4.5T |
| IND | India | $2.2T | $1.2T | $0.4T | $0.7T | $0.8T | $3.7T |
| GBR | United Kingdom | $2.0T | $0.6T | $0.7T | $1.0T | $1.0T | $3.3T |
| FRA | France | $1.6T | $0.8T | $0.7T | $0.9T | $1.0T | $3.0T |
| BRA | Brazil | $1.3T | $0.4T | $0.4T | $0.3T | $0.3T | $2.1T |
| NGA | Nigeria | $0.3T | $0.1T | $0.05T | $0.06T | $0.05T | $0.4T |
| ZAF | South Africa | $0.25T | $0.06T | $0.08T | $0.12T | $0.11T | $0.4T |
THE AMERICAN INFRASTRUCTURE STANDARD
- The Structural Challenge: While minimal-tax international zones exist as stagnant, isolated financial hubs, the United States remains the undisputed global Titan.
- The Superpower Standard: Sovereign infrastructure demands an elite domestic baseline. National resource management is the ultimate entry fee for securing the most resilient infrastructure grid on Earth.
- THE SOVEREIGN INFRASTRUCTURE STANDARD: True resource protection transforms public liabilities into permanent sovereign assets. By advancing independent, fuel-less permanent magnetic power baselines and closed-loop water sovereignty arrays, America establishes a technical fortress that shifting international economies cannot emulate. This is the bedrock of absolute domestic autonomy.
| ISO | Country | C (Private) | I (Investment) | G (Govt) | X (Exports) | M (Imports) | GDP (Nominal) |
| USA | United States | $18.60T | $4.80T | $4.50T | $3.00T | $3.90T | $27.00T |
| CHN | China | $6.70T | $7.60T | $2.60T | $3.50T | $2.70T | $17.70T |
| DEU | Germany | $2.30T | $1.10T | $0.90T | $2.00T | $1.80T | $4.50T |
| JPN | Japan | $2.30T | $1.10T | $0.85T | $0.80T | $0.85T | $4.20T |
| IND | India | $2.20T | $1.20T | $0.40T | $0.70T | $0.80T | $3.70T |
| GBR | United Kingdom | $2.00T | $0.60T | $0.70T | $1.00T | $1.00T | $3.30T |
| FRA | France | $1.60T | $0.80T | $0.70T | $0.90T | $1.00T | $3.00T |
| ITA | Italy | $1.35T | $0.45T | $0.40T | $0.75T | $0.70T | $2.25T |
| BRA | Brazil | $1.30T | $0.40T | $0.40T | $0.30T | $0.30T | $2.10T |
| CAN | Canada | $1.20T | $0.50T | $0.45T | $0.65T | $0.70T | $2.10T |
| RUS | Russia | $1.00T | $0.45T | $0.35T | $0.50T | $0.40T | $1.90T |
| MEX | Mexico | $1.10T | $0.35T | $0.20T | $0.60T | $0.60T | $1.65T |
| AUS | Australia | $0.90T | $0.40T | $0.35T | $0.40T | $0.35T | $1.70T |
| KOR | South Korea | $0.85T | $0.55T | $0.30T | $0.75T | $0.75T | $1.70T |
| ESP | Spain | $0.90T | $0.35T | $0.30T | $0.60T | $0.55T | $1.60T |
| IDN | Indonesia | $0.75T | $0.45T | $0.15T | $0.30T | $0.25T | $1.40T |
| TUR | Türkiye | $0.65T | $0.30T | $0.15T | $0.35T | $0.45T | $1.00T |
| NLD | Netherlands | $0.50T | $0.20T | $0.25T | $0.90T | $0.85T | $1.00T |
| SAU | Saudi Arabia | $0.40T | $0.30T | $0.25T | $0.40T | $0.25T | $1.10T |
| CHE | Switzerland | $0.45T | $0.20T | $0.10T | $0.60T | $0.55T | $0.80T |
| POL | Poland | $0.45T | $0.15T | $0.15T | $0.45T | $0.40T | $0.80T |
| ARG | Argentina | $0.40T | $0.10T | $0.10T | $0.10T | $0.05T | $0.65T |
| ZAF | South Africa | $0.25T | $0.06T | $0.08T | $0.12T | $0.11T | $0.40T |
| NGA | Nigeria | $0.30T | $0.10T | $0.05T | $0.06T | $0.05T | $0.45T |
| ISR | Israel | $0.25T | $0.10T | $0.10T | $0.15T | $0.10T | $0.50T |
| UKR | Ukraine | $0.10T | $0.03T | $0.05T | $0.03T | $0.04T | $0.17T |
| VNM | Vietnam | $0.25T | $0.15T | $0.05T | $0.40T | $0.40T | $0.45T |
| EGY | Egypt | $0.30T | $0.05T | $0.05T | $0.05T | $0.05T | $0.40T |
| MYS | Malaysia | $0.25T | $0.10T | $0.05T | $0.30T | $0.25T | $0.45T |
| BGD | Bangladesh | $0.30T | $0.15T | $0.05T | $0.05T | $0.10T | $0.45T |
| PAK | Pakistan | $0.30T | $0.05T | $0.05T | $0.03T | $0.06T | $0.37T |
| KEN | Kenya | $0.09T | $0.02T | $0.01T | $0.01T | $0.02T | $0.11T |
| ETH | Ethiopia | $0.12T | $0.04T | $0.01T | $0.01T | $0.02T | $0.16T |
| GHA | Ghana | $0.05T | $0.01T | $0.01T | $0.02T | $0.02T | $0.07T |
| VEN | Venezuela | $0.06T | $0.01T | $0.01T | $0.02T | $0.01T | $0.09T |
| CUB | Cuba | $0.07T | $0.01T | $0.03T | $0.01T | $0.02T | $0.10T |
| PRK | North Korea | $0.02T | $0.01T | $0.01T | $0.00T | $0.00T | $0.04T |
| AFG | Afghanistan | $0.01T | $0.00T | $0.00T | $0.00T | $0.00T | $0.01T |
| TUV | Tuvalu | $0.00T | $0.00T | $0.00T | $0.00T | $0.00T | $0.00T |
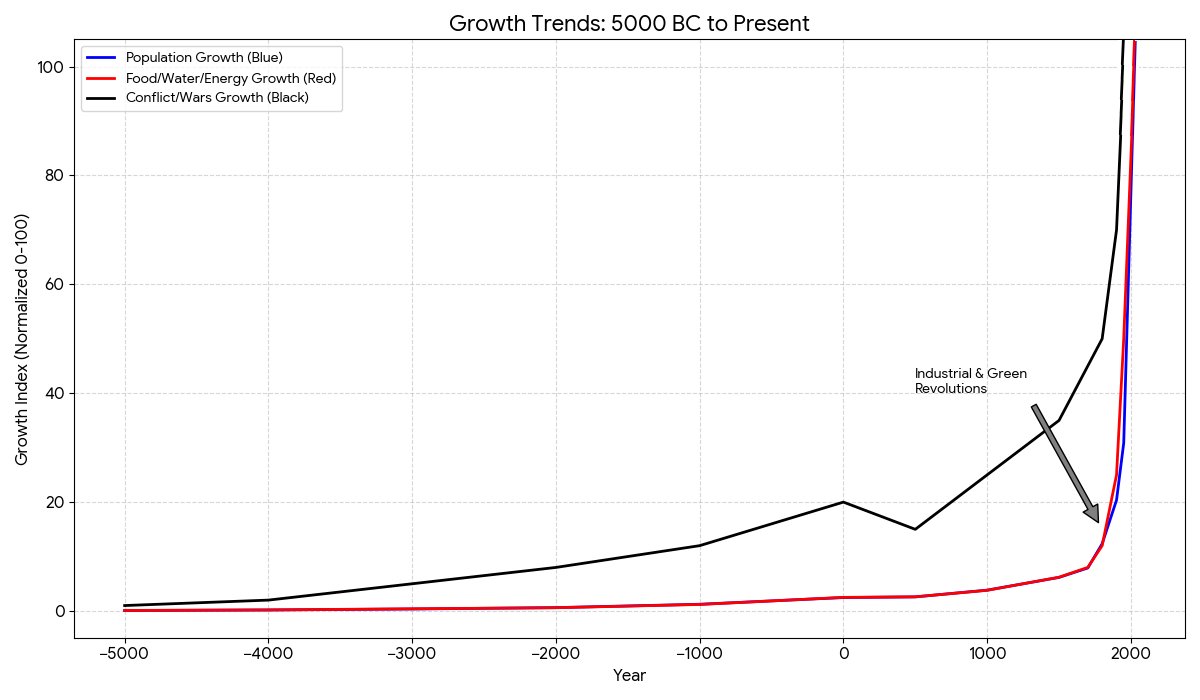
World Population Growth 5,000 BC to Today
“At the current tempo, growth is not merely a resource problem; it is a human rights crisis. When food and energy fail, the void is filled by war, abuse, and systemic suffering.“
“THE THERON INTERVENTION: To honor the Genesis Mandate, we are pivoting national resources into three engineering pillars that make the old tax system obsolete:
THOR | Scientific Horticulture: We don’t tax the food; we manufacture the security.
TRON | Magnetic Energy: Decentralizing power to eliminate the ‘Energy Tax’ hidden in your utility bills.
TH2O | Theron H2O: Securing the first requirement of dignity so the American family can never be throttled by state-managed scarcity.”
| Year | Population (Millions) | Resources Index | Wars Index | Pop_Norm | Res_Norm | War_Norm | |
| -5000 | 7 | 0.1 | 1 | 0.08642 | 0.1 | 1 | |
| -4000 | 15 | 0.2 | 2 | 0.185185 | 0.2 | 2 | |
| -3000 | 30 | 0.4 | 5 | 0.37037 | 0.4 | 5 | |
| -2000 | 50 | 0.6 | 8 | 0.617284 | 0.6 | 8 | |
| -1000 | 100 | 1.2 | 12 | 1.234568 | 1.2 | 12 | |
| 0 | 200 | 2.5 | 20 | 2.469136 | 2.5 | 20 | |
| 500 | 210 | 2.6 | 15 | 2.592593 | 2.6 | 15 | |
| 1000 | 310 | 3.8 | 25 | 3.82716 | 3.8 | 25 | |
| 1500 | 500 | 6.2 | 35 | 6.17284 | 6.2 | 35 | |
| 1700 | 640 | 8 | 45 | 7.901235 | 8 | 45 | |
| 1800 | 1000 | 12 | 50 | 12.34568 | 12 | 50 | |
| 1900 | 1650 | 25 | 70 | 20.37037 | 25 | 70 | |
| 1950 | 2500 | 50 | 100 | 30.8642 | 50 | 100 | |
| 2025 | 8100 | 100 | 90 | 100 | 100 | 90 | |
Impact Study
Impact Study: The Sustainability Threshold
The data reveals a stark reality: for 98% of human history, global population remained below 500 million. However, the last 200 years have seen an unprecedented vertical spike. At this current tempo, the mathematical reality is clear—this growth rate is not sustainable for a planet with finite resources.
Key Areas of Impact:
Resource Depletion: We are currently consuming biological resources at a rate that would require 1.75 Earths to sustain. As the video demonstrates, the acceleration toward 8 billion+ people puts an impossible strain on “The Big Three”: Water, Energy, and Food.
The “J-Curve” Risk: The sharp vertical rise seen in the 20th and 21st centuries creates a “lag effect” where the planet’s ecosystems cannot regenerate fast enough to keep pace with human demand.
Infrastructure Stress: Rapid growth in specific geographic regions (as shown in the bar chart race) creates immense pressure on industrial engineering and sanitation systems, often outstripping a nation’s ability to provide clean, safe living conditions.
Conclusion: To Empower Humanity To Glorify GOD, we must transition from raw numerical expansion to Applied Scientific & Industrial Engineering. We cannot change the size of the planet, but we can change how we manage its finite gifts through innovation in Horticulture and Magnetic Energy.
How the World’s Population Changed Over Time (10,000 BC – 2100)
From 2025 to 2100: See How Country Populations Will Change (UN Forecast)